Synchronization Window
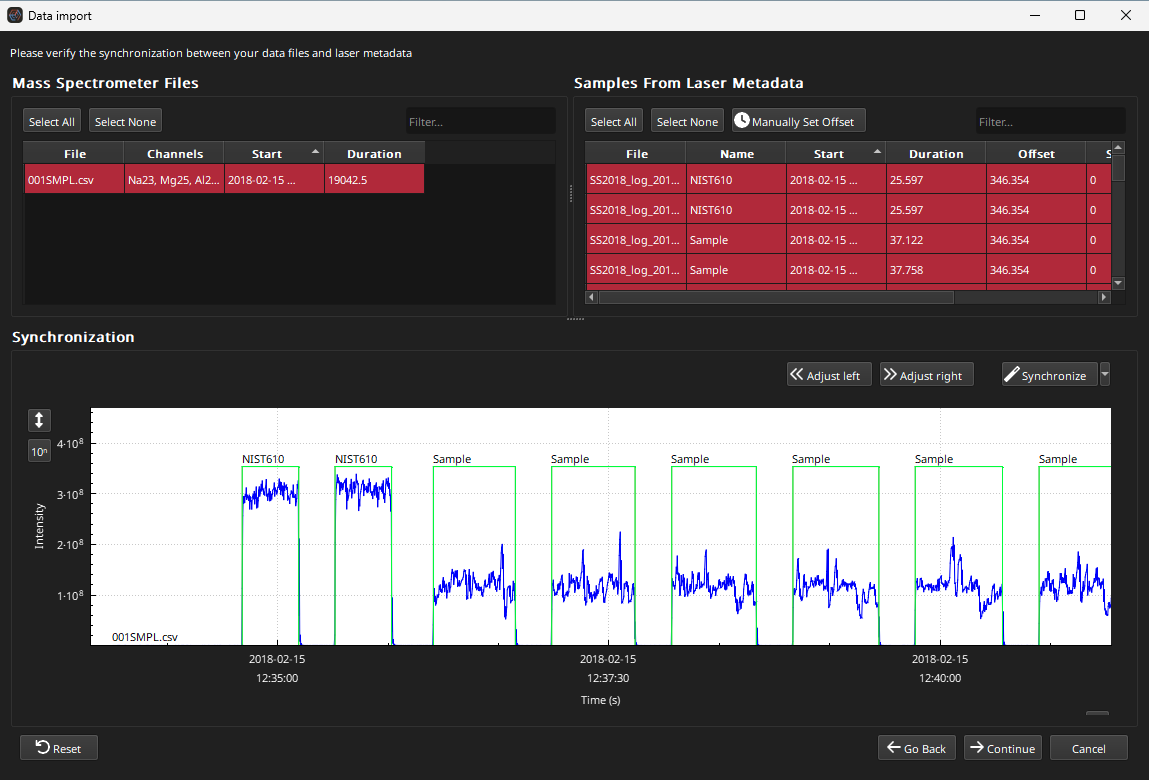
The Synchronization Window is the second window in the import process. An example is shown in Fig. 3. This window is used to synchronize the mass spec data with the laser log file.

Fig. 3 The Synchronization Window in iolite Essentials.
The top half of the window has two tables: one for mass spec files (left), and one for laser log samples read from the laser log file (right). The bottom half of the window shows a graph with the mass spec data and laser log samples plotted: the ‘Sync Plot’.
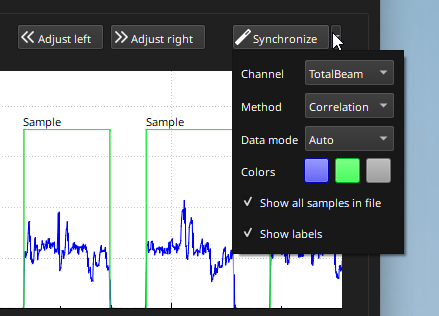
The Synchronize button at the top right of the graph can be use to synchronize the mass spec data with the laser log file. Options for the synchronization algorithm can be accessed by clicking the down arrow to the right of the Synchronize button. These options are shown in Fig. 4 and described below. More details about the Mass Spec Files Table and Laser Log Samples Table are provided below.
Tip
Down arrows beside buttons are common in Essentials and usually show more options for the current context.

Fig. 4 The Synchronization Window options in iolite Essentials.
Synchronization Options
These options include which mass spec channel to sync with. Typically, this will be TotalBeam. The Method options allow for find the best offset between mass spec and laser log samples. These include ‘Correlation’ (the default) which maximises correlation between the mass spec and laser log data. The ‘Rising Edge’ option, the rising edge of the mass spec data will be synced with the laser log files (rather than the maximum correlation).
‘Data Mode’ options determine how the laser log will attempt to sync with the laser log:
‘Selection’ mode is where mass spec files and laser log samples selected in the upper half of the window are synchronized. This results in a single offset for all laser log samples as described in Paul et al. (2012) (equivalent to the default sync in iolite v4).
‘Pairwise’ mode is used where each mass spec file is synced with a laser log sample (i.e. there is a separate mass spec file for each sample). This produces a synchronization offset for each sample. This can be more accurate if there is a variable offset between samples.
‘Local’ mode finds the best offset for each laser log sample when searching the immediate (local) area of the mass spec data. This is equivalent to the Sample Sync option in iolite v4, and can help where there is a variable offset between samples but not every sample has been measured in a seperate mass spec file.
If the ‘Show all samples in file’ option is not checked, only samples selected in the laser log samples list will be shown in the plot. Otherwise, all samples are shown, either as selected (green by default) or unselected (grey by default).
These colors can be changed with the ‘Colors’ option: the first color is the mass spec data color, the second is the selected laser log sample(s) color, and the third is the unselected laser log samples color (if the ‘Show all samples in file’ checkbox is checked).
The ‘Show labels’ option selects whether the laser log sample labels are shown in the Sync Plot.
Sync Plot
The Sync Plot shows the mass spec data (in purple by default) and the laser log samples (in green by default). Scrolling the mouse wheel over the graph zooms the x-axis in and out. This can be reset by clicking the button in the bottom right. If this button is not visible, the window can be expanded slightly to show it. Scaling in the vertical axis can be reset by clicking the button to the left of the vertical axis. The vertical scale can be changed to/from logarithmic scale by checking or unchecking the ‘10ⁿ’ button to the left of the vertical axis.
The offset for selected laser log samples can be manually adjusted by holding the shift key and clicking and dragging the green trace in the Sync Plot. It can also be adjusted using the ‘<< Adjust left’ and ‘>> Adjust right’ buttons.
Mass Spec Files Table
The Mass Spec Files list (top left of window) shows mass spec files found in the folder selected for import. If there is a file you don’t wish to import, you can right click on the file and select ‘Toggle inclusion’ to select whether the file will be imported or ignored.
If a file fails to import for some reason (the most common being an ambiguous or erroneous timestamp format) it will appear with an exclamation mark next to its name. It will also be missing any channel or timing information in the table. If this is the case, the timestamp format can be manually selected using the “Reprocess with date format” option in the right-click menu, or iolite Essentials can try to automatically determine the timestamp format by comparing with the laser log timestamps using the “Reprocess with automatic format” in the right-click menu.
Right-clicking on the headers of the Mass Spec Files Table shows options for what columns are visible in the table. Options include File name, Samples, Channels, Start time, End time, Duration and file Size.
There are buttons at the top for selecting or deselecting all files in the table. The filter search field (top right) will filter the table so that only files with names matching the filter are shown.
Selecting any file (or files) in the table will show only those files in the Sync Plot. See the Sync Plot Context Menu section above for details about automatic resizing of the Sync Plot when clicking on files in the Mass Spec Files Table.
Laser Log Samples Table
The Laser Log Samples Table shows samples recorded in the laser log file(s) found in the folder selected for import. By default, the following details are shown:
File the records the sample
Name (the label recorded in the laser log file)
The start time recorded in the laser log file
The duration
The offset to be applied to this sample (the sync offset)
Other options for fields that can be shown in the table are accessed by right-clicking the header of this table. These options include:
Destination (normally set in the following step in the import process)
End time recorded in the laser log file
Spot size
Rep rate
Scan speed
Start crop (normally set in the following step in the import process)
End crop (normally set in the following step in the import process)
There are buttons at the top for selecting or deselecting all files in the table. The filter search field (top right) will filter the table so that only samples with Names matching the filter are shown.
Sample offsets can be manually set by selecting the samples and clicking the Manually Set Offset button. Offsets can be also be set visually as described in the Sync Plot section.
Selecting any sample (or samples) in the table will show only those samples in the Sync Plot. See the Sync Plot Context Menu section above for details about automatic resizing of the Sync Plot when clicking on files in the Mass Spec Files Table.
Tips for working with difficult synchronizations
There will be occasions where synchronization between the laser log and mass spec files will be difficult. This usually occurs because of inaccurate timing in the mass spec timestamps. Here are a few tips for handling those situations:
If you have an individual mass spec file for each laser sample, changing the Synchronization “Data mode” to “Pairwise” (in the Synchronization Options) can greatly improve the match.
If all your data are in one mass spec file but the offset between each sample appears different, changing the Synchronization “Data mode” to “Local” (in the Synchronization Options) can improve the matches. This is not foolproof however, and you may need to adjust individual samples manually. This can be done by selecting the sample in the Laser Log Sample Table and holding the Shift key while dragging the sample to manually adjust its offset. See the tip in the Sync Plot section above about automatic resizing of the Sync Plot when clicking on samples in the Laser Log Samples Table.
Continuing the Import Process
Clicking the Continue button will continue to the next step in the import process (selecting sample destinations).
Clicking the Go Back button will return to the window where the import folder is selected.
Clicking the Cancel button will return to the Welcome Window.
Clicking the Reset button (bottom left) starts the import process again.