Baseline Settings Window
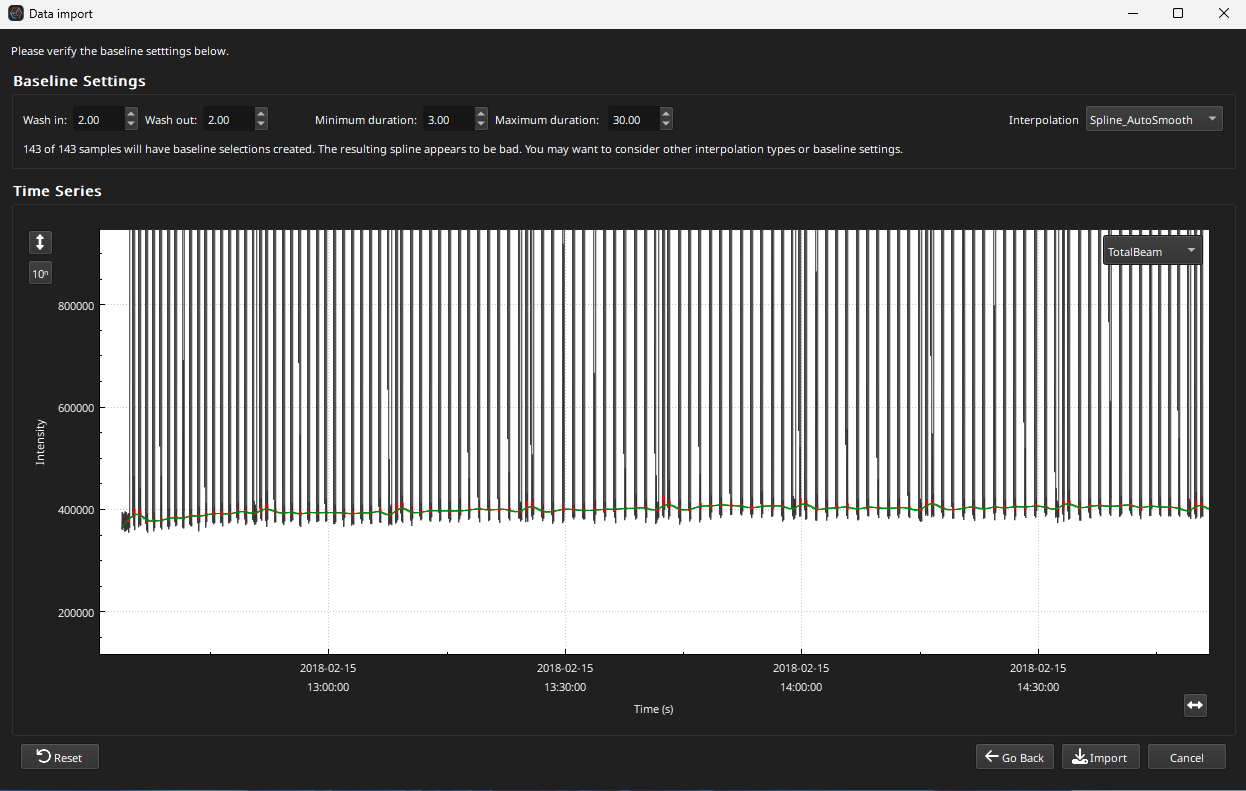
The Baseline Settings Window is the fourth window in the import process. An example is shown in Fig. 6. This window is used to select intervals to be treated as baselines.

Fig. 6 The Baseline Settings Window in iolite Essentials.
At the top of the Baseline Settings Window there are controls for Wash In/Out settings (explained below), as well as minimum and maximum selection durations. In the bottom half part of the window is a graph showing the selections that will result from the chosen settings.
Essentials will try to create baseline selections wherever the laser log file indicates that the laser was not firing. However, this may time intervals where the signal is still returning to backgrounds after an ablation wash-out or intervals where the signal has not fully reached the mass spec wash-in. Avoiding washin and washout provides a better estimate of the background for each channel.
At the top of the Baseline Settings window, the amount of time to avoid before each analysis can be set via the ‘Wash in’ setting in the top left of the window. Similarly, the amount of time to avoid after each ablation ends can be set via the Wash out setting. If there is very little time between ablations, only a few datapoints may remain after excluding the washin and washout intervals. These datapoints may have large uncertainties and not provide a good estimate of the backgrounds. Avoiding such short intervals can be achieved by setting the minimum duration setting (top center), typically a few seconds in duration. Less often, there may be reasons a maximum duration should be set, which can be achieved via the Maximum duration setting.
Adjusting these settings updates the baseline plot in real time. The spline type (the type of interpolation between the selections) can be set in the top right of the window.
Scrolling with the mouse wheel over the baseline plot zooms in/out in both the vertical and horizontal axes. Clicking the button on the bottom right of the plot resets the horizontal axis. Clicking the button at the top left of the plot resets the vertical axis. Clicking the ‘10ⁿ’ button toggles between a logarithmic/linear vertical axis.
The channel shown in the plot can be changed using the drop-down menu in the top right of the plot.
Clicking the Reset button will start the import process from the beginning.
Clicking the Continue button will finish the import process, and show the main Essentials Window.
Clicking the Go Back button will return to the Synchronization Window.
Clicking the Cancel button will return to the Welcome Window.